I would like to order the groups in both the legend and plot of a ggplot created with geom_bar.
Here is an example
mydata <- data.frame(mygroup = c('A', 'A', 'A', 'A', 'B', 'B', 'B', 'B'),
                     mysubgroup = c("north", "west", "south", "east", "north", "west", "south", "east"),
                     value = c(5,10,6,12, 4, 4, 3, 5))
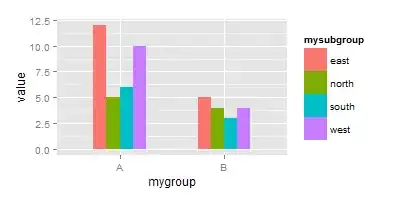
My starting point:
myplot <- ggplot(mydata, aes(mygroup, value, fill = mysubgroup)) +
            geom_bar(position = "dodge", width = 0.5, stat = "identity")
myplot
I would like to have both the legend and the bars plotted in the order "north", "south", "east", "west".
I have tried adding scale_fill_discrete(limits = c("north", "south", "east", "west")) to the plot. It puts the legend in the desired order, but not the bars (although the bars are rearranged).
myplot + scale_fill_discrete(limits = c("north", "south", "east", "west"))
even if I reorder the data, I get the same result as above:
mydata2 <- mydata[c(1,3,4,2,5,7,8,6),]
myplot2 <- ggplot(mydata2, aes(mygroup, value, fill = mysubgroup)) +
               geom_bar(position = "dodge", width = 0.5, stat = "identity")
myplot2 + scale_fill_discrete(limits = c("north", "south", "east", "west"))